 |
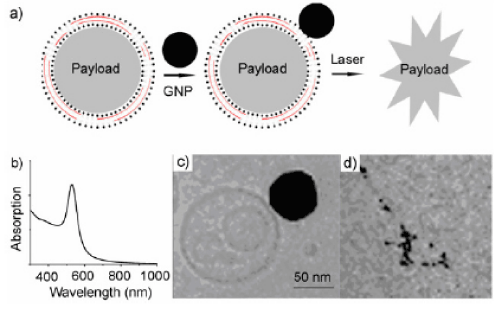
| Figure 8 :(a) Illustration of the releasing process; (b) UV–vis absorption spectrum of gold nanoparticles (GNPs); (c) a typical cryo-EM image of a PPL tethering a GNP; and (d) a typical cryo-EM image showing PPL/GNP complexes after laser irradiation. The scale bar in (c) also applies to (d). Reproduced with permission (Figure 3 of Reference 109). |