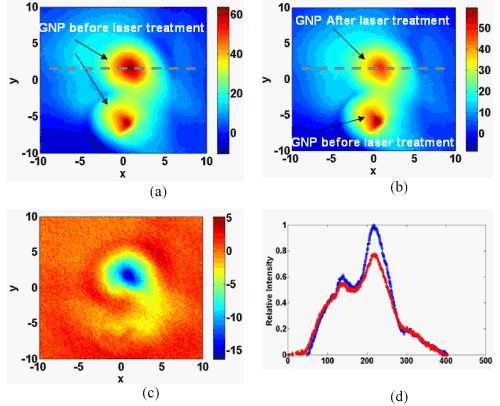
(a) Photoacoustic image of GNP targets before high energy laser triggering
(b) Photoacoustic image of GNP targets after high energy laser triggering
(c) subtract image between photoacoustic images shown in (a) and (b)
(d) Quantitative curves along the center of the evaluation target before/after high energy laser triggering of GNP solution.