|
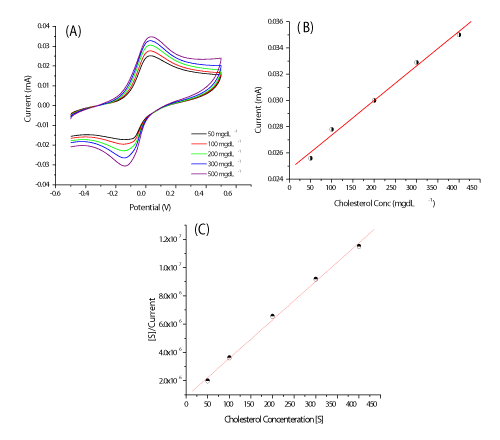
| Figure 7: (A) CV recorded for ChOx/PANI-(CdS-QD)/ITO bioelectrode as a function of concentration of cholesterol (50 to 500 mg dL-1) in PBS (50 mM, pH 7.4, 0.9% NaCl) solution at the scan rate of 30 mV/S; (B) calibration plots derived from CV measurements at 0.03 V as a function of cholesterol concentration; (C) Hanes plot between the substrate concentration and substrate concentration/current value obtained from plot A. |