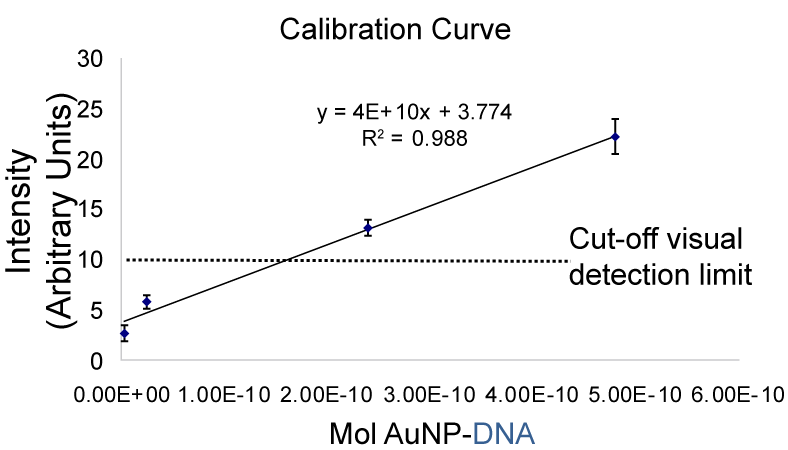
Figure 5:
Calibration curve of the intensity of the red band against the amount of AuNP-DNA captured. A linear relationship is observed where the cutoff detection limit corresponds to 156 pmol of AuNP-DNA.