 |
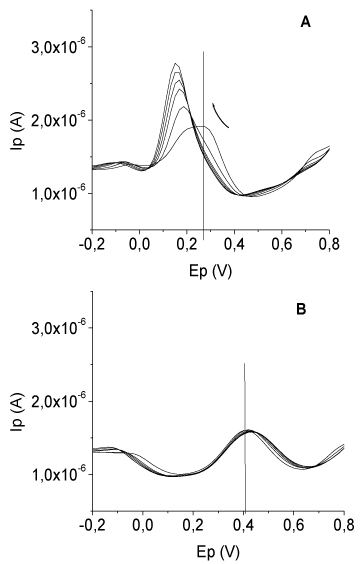
| Figure 7: Urate additions (concentrations: 20, 40, 60, 80 and 100 mmol L-1) in serum (diluted in PBS 1:4) in the presence of 100 mmol L-1 CPC (A), and in the absence of CPC (B), pH 7.4. Both samples contained ascorbate in the concentration of 100 mmol L-1, added previously. The measures were made in triplicate for each concentration. The arrow indicates the trend of the voltammogram behavior with urate concentration increase. |