 |
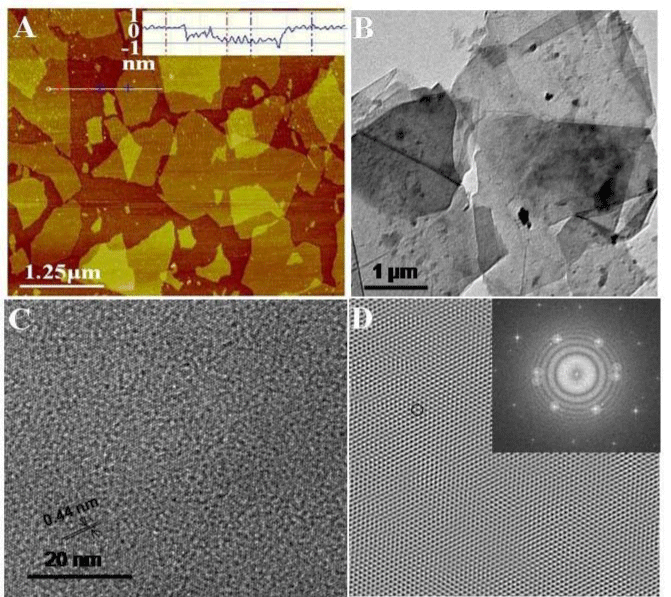
| Figure 2: (A) AFM images of the spin coated GO sheets; (B) TEM micrograph showing the spread out GO sheets; (C) HRTEM image showing the lattice image of single GO sheet; (D) IFFT reconstructed image clearly depicting the atomic resolution image of GO, inset shows the SAED pattern from the multilayer region. |