 |
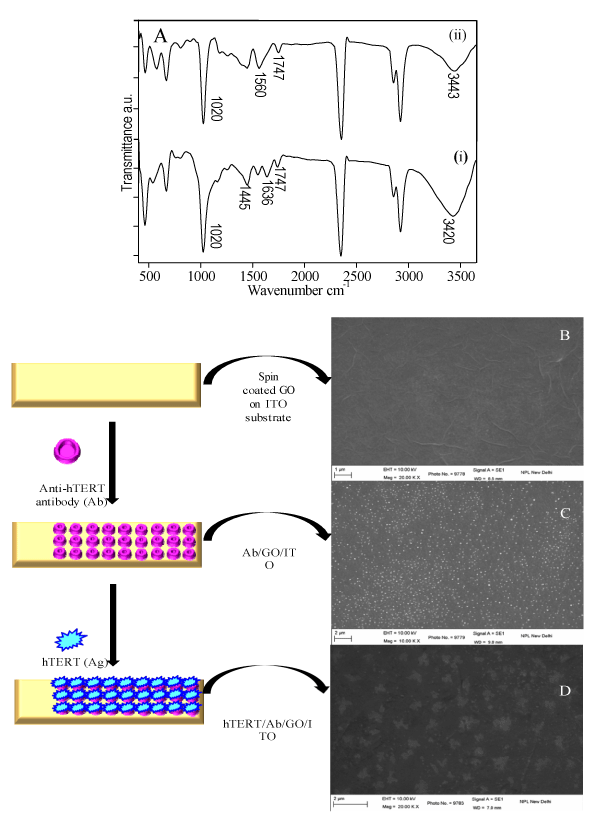
| Figure 4: (A) FTIR spectrum of GO (curve 1) and Ab/GO/ITO (curve 2) indicating the presence of functional groups; (B-D) SEM images of GO/ITO, Ab/GO/ITO and hTERT/Ab/GO/ITO immunoelectrode along with schematic representation of respective surface modifications on the left side. |