 |
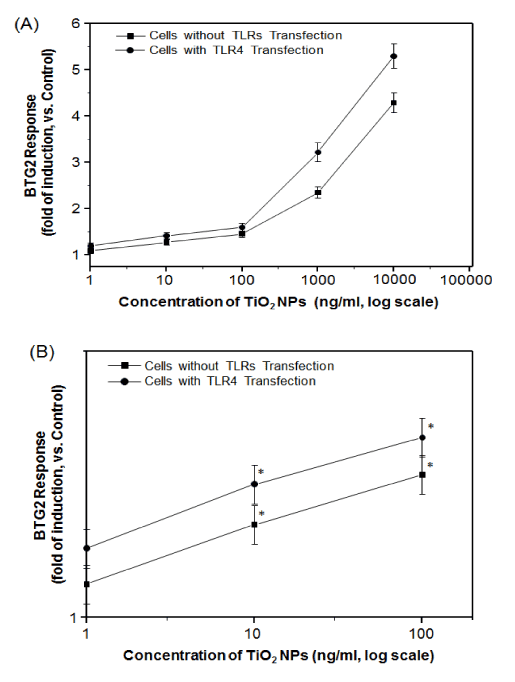
| Figure 4: (a) Effect of TLR4 on BTG2 response (fold of induction) of HepG2 cells transfected with BTG2 promoter-luciferase reporter plasmid and TLR4 expression vector. (b) An expanded view of the response at low concentrations of TiO2 NPs. Transfected cells were exposed to the indicated concentrations of TiO2 NPs for 48 h. The results are shown as mean ± S.D., n ≥ 3 for each concentration. |