 |
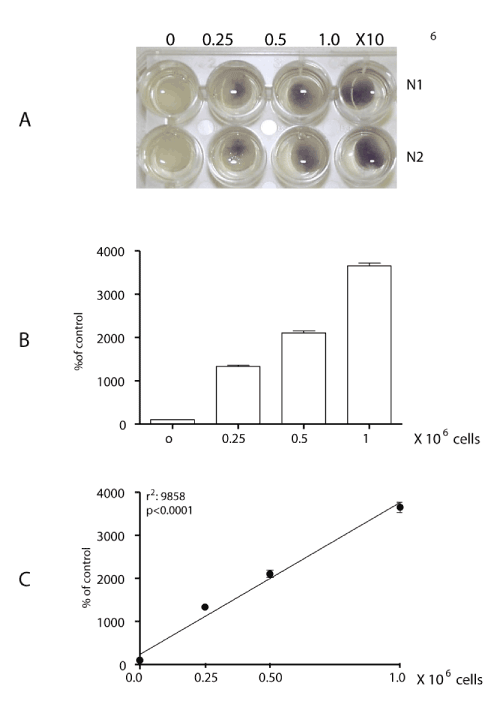
| Figure 4: Determination of cell seeding in 3D liver cell model using MTT assay. 0, 0.25 x 10⁶, 0.5 x 10⁶ and 1 x 10⁶ HepaRG cells are grown within scaffold for 24 h. A) Scaffolds in culture plates containing different numbers of HepaRG cells. The metabolic activity (MTT assay) of cells and cell seeding is analyzed optically via presence of intracellular blue formazan in the scaffolds. B) After adding cell lysis buffer and shaking, the blue formazan is extracted and MTT assay was analyzed colorimetrically, and C) Reference curve and linear regression, SEM ± 3-4. |