 |
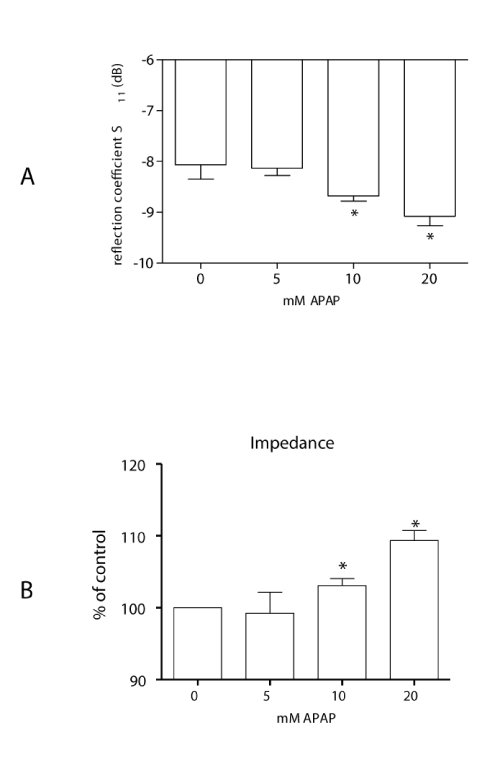
| Figure 5: Dose-dependent effect of APAP on the 3D liver cell model analyzed using reflection coefficient S11 measurement by means of needle-like electrodes after 24 h incubation time with APAP. A) Bar chart of reflection coefficient S11. SEM ± 6-8. *p < 0.05 vs 0 mM APAP. B) Bar chart of calculated impedance at 73 MHz, SEM ± 6-8. *: p < 0.05 vs. 0 mM APAP (untreated 3D liver cell models were set as 100%). |