 |
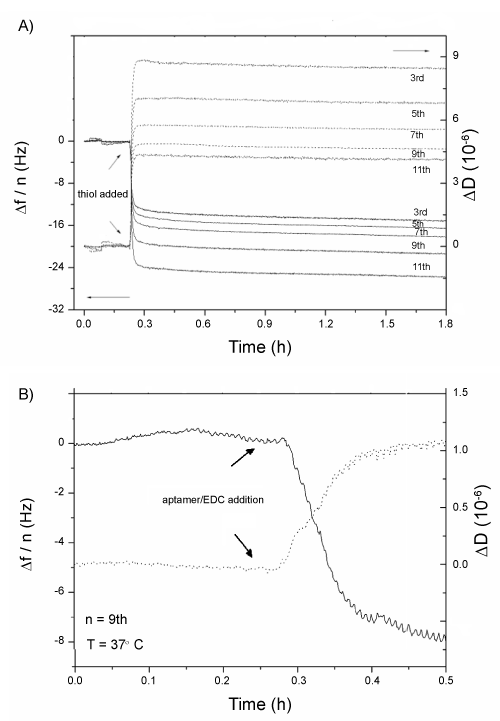
| Figure 3: a) Time evolution of the normalized frequency (Δf/n) (solid lines) and ΔD (dashed lines) during SAM formation b) Time evolution of the change in frequency (solid line) and ΔD (dashed line) at the 9th overtone during aptamer attachment via EDC coupling. For both experiments, the temperature was stabilized at 37.00 °C and the system was operated under flow conditions (rate 200 μL/min). |