 |
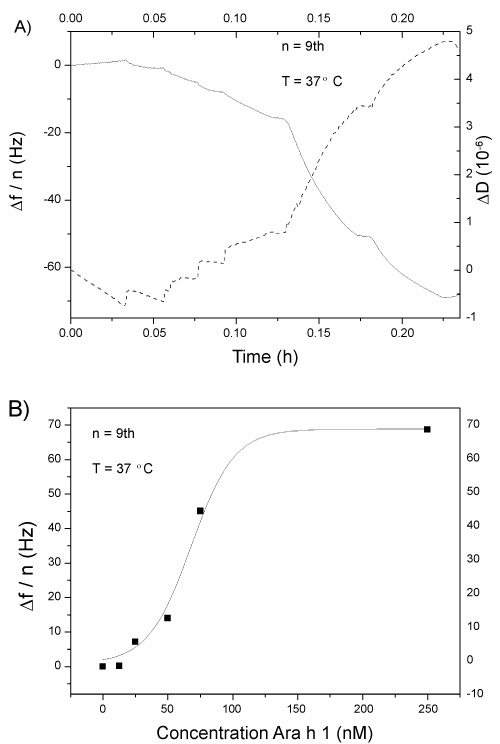
| Figure 4: a) Response in the differential frequency, Δf/n and in ΔD upon exposure of increasing concentrations of Ara h 1 in TGK buffer. The fit, curve given as a solid line, corresponds to a typical sigmoidal plot with an R2 of 0.99. b) Dose-response curve constructed by plotting the concentration vs the response in frequency. All results shown belong to the 9th overtone and were obtained at T = 37.00°C. The error bars were calculated by averaging out the data over three separate measurements, but can be smaller than symbol size. |