|
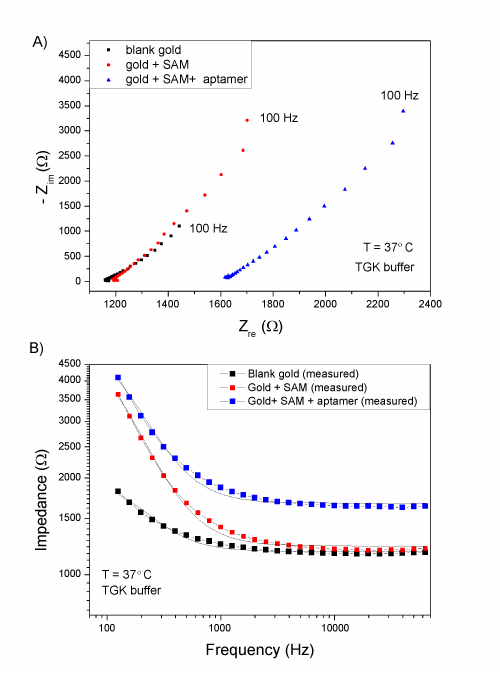
| Figure 5: a) Nyquist plots obtained after measuring blank gold (black solid squares), the same sample modified with SAM (red solid circles) and followed by aptamer attachment (blue solid circles). b) This data was fitted with a three parameters equivalent circuit and the results of the measured (filled squares) and fitted (solid lines) impedance data are shown. The frequency and impedance are both plotted logarithmically. All measurements were performed in TGK buffer at 37°C. |