|
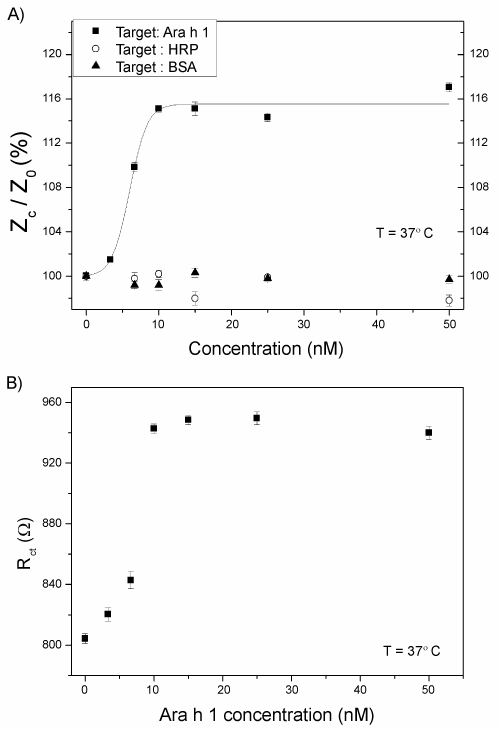
| Figure 6: a) is the dose-response curve and shows the normalized response (Zc / Z0) at a frequency of 316 Hz (T = 37°C) when solutions of Ara h 1 in PBS (3.33, 6.67, 10, 15, 25, 50 nM) were introduced. As reference test, the same experiment was performed with the proteins HRP and BSA. The error bars were taken over three measurements which were performed independently with freshly prepared electrodes. The fit given for the Ara h1 concentration is a typical sigmoidal plot with a R2 of 0.98. b) demonstrates that the impedance increase mainly can be attributed to an increase in the charge transfer resistance Rct. |