 |
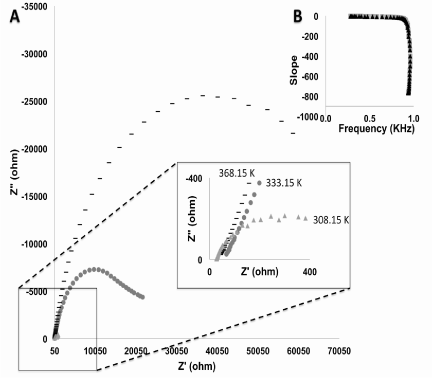
| Figure 1: This is a representation of a Nyquist curve based off impedance readings of TP immobilized on GDEs at three temperature values of 368.15K, 333.15K, and 308.15K. (B) This graph shows the relationship of a logarithmic fit slope at the optimal frequency of 175.8. |