 |
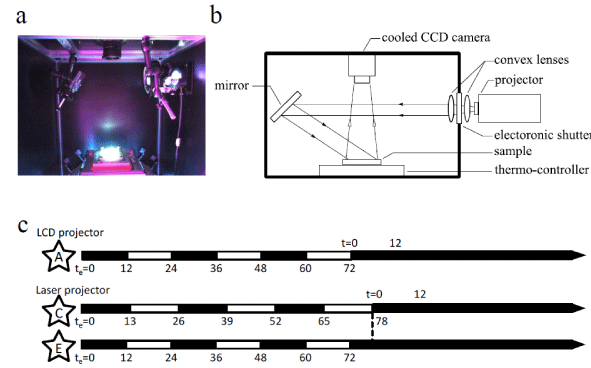
| Figure 1: Phase control system of the cellular circadian rhythms. (a) The photograph of the phase control system. (b) The schematic design of the phase control system. Light was reflected in the sputtering mirror through multiple lenses, and it was projected on the sample on the thermo-controller. (c) Illumination protocol of LCD and laser projector. The start time of the entrainment and measurement were at te = 0 h and t = 0 h, respectively. The star labelled with A, C and E explained the illumination period of the star-shaped pattern in Figures 2e and 3d. The white and black bar before t = 0 show the bright and dark star-shaped pattern, respectively. Subsequently, black bar shows DD condition. |