|
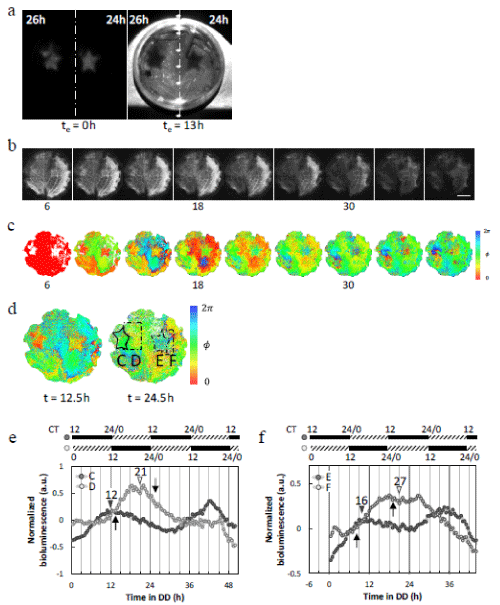
| Figure 3: Circadian rhythms with different two star-shaped initial conditions in an AtCCA1::LUC lettuce leaf induced by spatiotemporal illumination using scanning laser projector. (a) Bright and dark star pattern illumination. Dash dotted line showed the boundary two illumination protocols: LD24 (right) and LD26 (left). (b) Snapshots of bioluminescence under DD (Interval between images = 4 h, scale bar = 10 mm). (c) Phase image of bioluminescence in the leaf of Figure 3b (Interval between images = 4 h). (d) Inversion phase images of bioluminescence in the leaf of Figure 3b. t = 12.5 (left) and 24.5 h (right), respectively. (e,f) Normalized bioluminescence in the star region C and E (gray) and the region to its right (D and F) (white), indicated by the lines in Figure 3d with peak time which was elapsed time since 72 h after applying illumination.Gray and white triangles indicated measured peak time of the normalized bioluminescence and arrows indicated expected peak time. Black bars: subjective day; hatched bars: subjective night. leaf showed the rapid decay of cellular bioluminescence |