 |
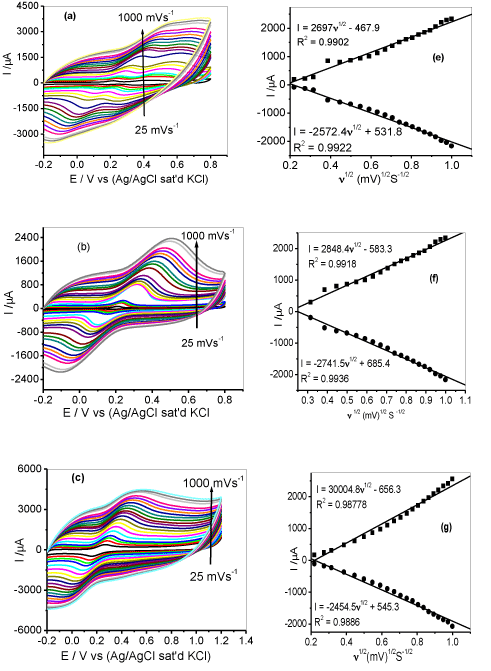
| Figure 10: Cyclic voltammograms scan rate study of modified electrodes (a) GCE-MWCNT- NiO, (b) GCE-MWCNT-ZnO and (c) GCE-MWCNT-Fe3O4 in 1 × 10⁻⁴ M DA at various scan rates: 25-1000 mVs−1 (e-g are the linear plots of current versus square root of scan rate for GCE-MWCNT-NiO, GCE-MWCNTZnO and GCE-MWCNT- Fe3O4 respectively. |