|
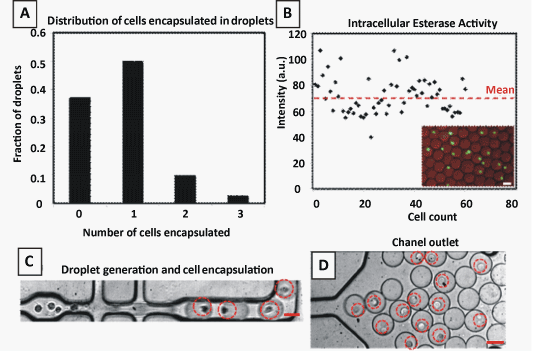
| Figure 2: (A) Representation of deterministic encapsulation of single cells into pico-droplets; (B) Plot representing the distribution of intracellular esterase activity seen in cells; the scale bar refers to 50 μm; (C,D) Images of the droplet forming region and the channel outlet showing single cells encapsulated into individual droplets. |