 |
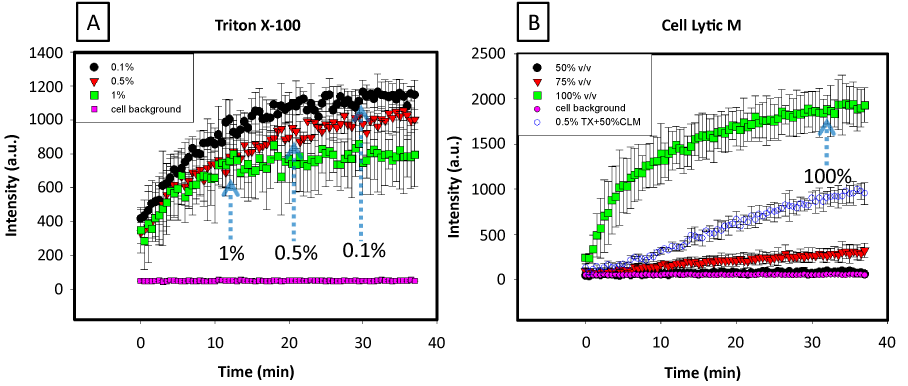
| Figure 4: Intensity plots representing cell death in a 96 well plate. (A) Describes the rate of cell death for increasing concentrations (0.1, 0.5, 1%) of Triton X-100; (B) Describes the rate of cell death for increasing concentrations of Cell Lytic M solution. A combined effect of 50% v/v cell lytic and 0.5% Triton X-100 is also shown. |