 |
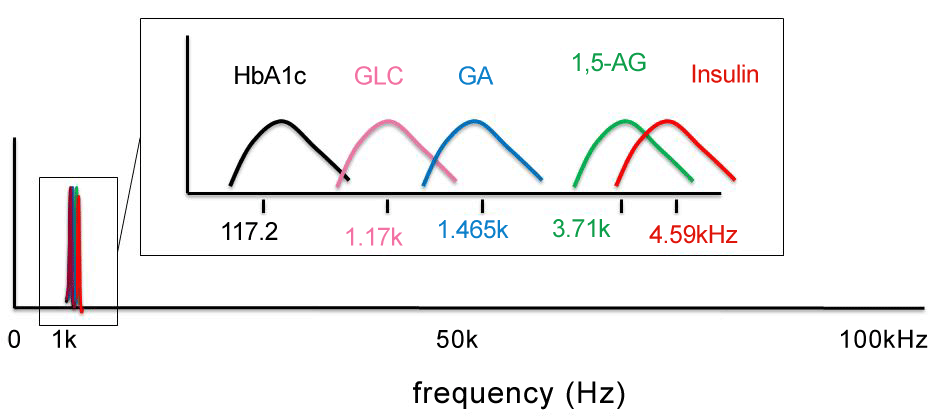
| Figure 1: Schematic representation of maximum binding-interaction of target and molecular recognition elements for multiple diabetes markers. INSETclose up showing marker and actual frequency data of maximal interaction from experiments showing issue of potential overlap (NOTE frequency values are actual data but curves are NOT actual data but representation of shape of an idealized frequency response). |