 |
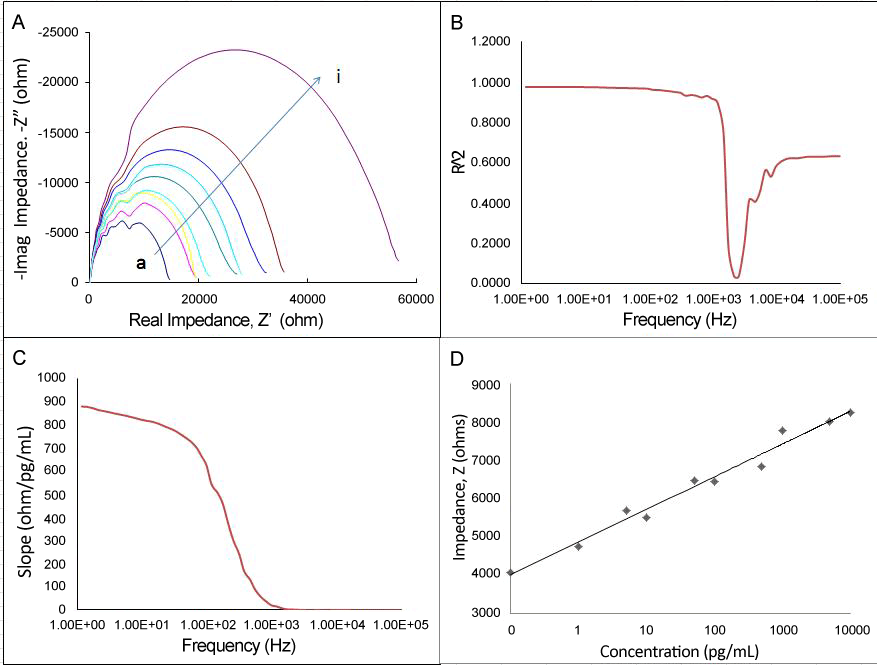
| Figure 6: Experimental results from tuned interleukin-12 (IL-12) showing (A) resulting Nyquist plots of an IL-12 concentration gradient from (a) blank to (i) 10,000 pg/mL of IL-12 binding to 20 nm tuned AuNP. In (B) a tightness of fit from the resulting concentration gradient, calculated for each frequency and plotted reveals that the optimal frequency of binding for this target is at 1 Hz now (tuned from 5 Hz) based upon tightness of fit. (C) Responsivity of tuned system also showing maximal response has also been tuned to 1 Hz over the frequency range by calculation of slope of each concentration bound for each frequency. Finally, optimized correlation plot of impedance at 1 Hz plotted against the concentration gradient for the IL-12: tuned anti-IL-12 system. |