 |
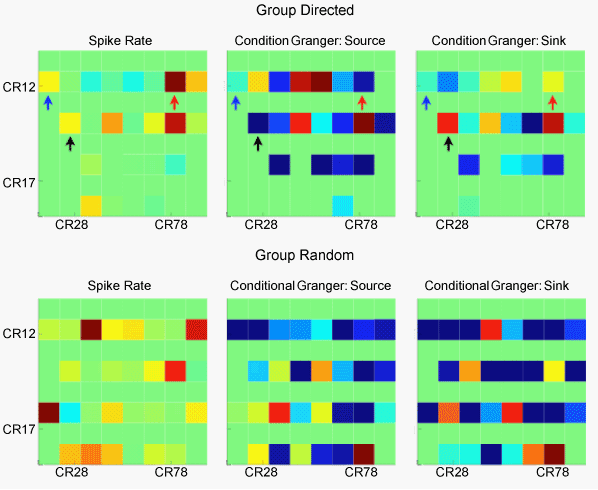
| Figure 4: Plasticity measured by changes in spike rates and compared with changes in Granger causal strength. The first column of plots depicts changes in mean spike rates (blue=decreasing, green=no change, red=increasing) for one culture in Group Directed (top panel) and Group Random (bottom panel). The right two columns display changes in Granger causal strength in terms of each electrode’s “driving” influence upon other electrodes (as a causal source) or changes in the strength of incoming pathways (a causal sink). Both spike rates and Granger causal strengths increased (LTP) or decreased (LTD) in both groups dependent on their location within the 8×8 electrode grid. Granger analysis indicates that these changes in spike rates were likely due to a combination of both increasing the strength of select causal sources and or by increasing the strength of incoming influence of other neurons to select electrodes (causal sink). (Color scales are ± abs (max change). Data is from one culture in each group). |