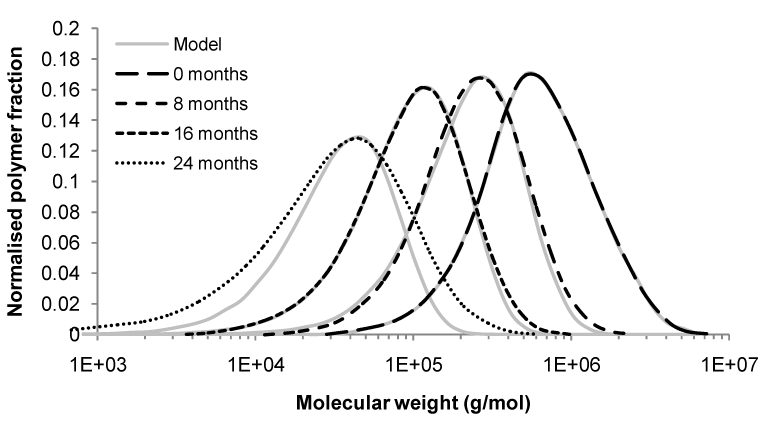
Figure 5:
Molecular weight distribution of experimental data [14] (black lines) and the model (grey lines) after degradation of PDLA for various times: 0 months (long dash); 8 months (medium dash); 16 months (short dash); and 24 months (dotted).