 |
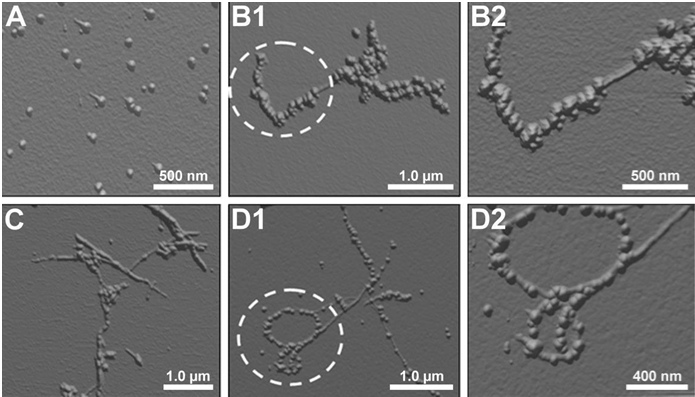
| Figure 2: AFM images of the human insulin amyloid fibril/γ-Fe2O3 nanoparticle assemblies prepared by fibrillation of human insulin in the presence of 6 (w/w)% of γ-Fe2O3 nanoparticles for different time intervals: 3 (A), 3.5 (B1,B2), 4 (C) and 5 (D1,D2) h. B2 and D2 represent higher magnification of the circled regions shown in B1 and D1, respectively. |