|
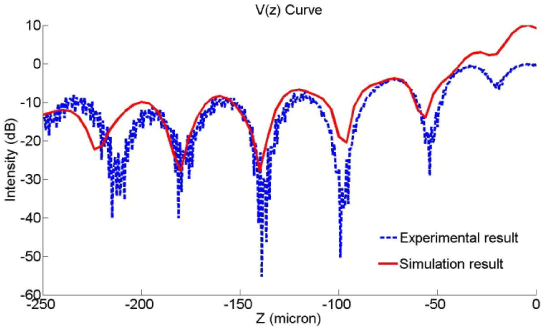
| Figure 5: A typical experimental V(z) curve shown in blue line and the simulated V(z) curve in red line. The curve was obtained at room temperature on hydrated onion epidermis. The vertical axis is the intensity of the received signal. The horizontal axis is the defocusing distance of the lens. Z=0 represents the position of the lens when it is focused on the top surface of the specimen. The curves are obtained as the lens is moved deeper into the interior of the specimen. |