 |
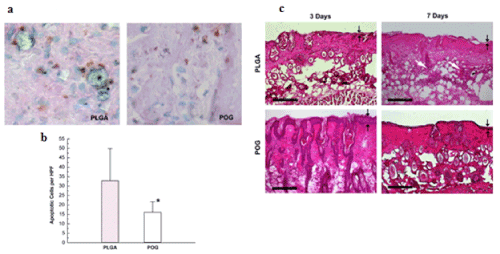
| Figure 3: (a) Histological analysis, 100×: Hematoxylin and Eosin stains of the skin flaps harvested at 3 and 7 days showed delayed necrosis in the oxygen group with better conservation of tissue architecture, epidermis height (black arrows), hair follicles and sebaceous glands. Differences were more prominent at the 7 days (white arrows show necrotic hair follicles). The size bar represents 500 μm. (b) Evaluation of apoptosis after 3 days: (c) Representative sections of dermis showing apoptosis positive cells with brown nuclei (nuclei counterstained with methyl green). A significant higher number of apoptotic cells were found in the dermis of the control (PLGA) group when compared with the treatment group (POG) (n=7, p=0. |