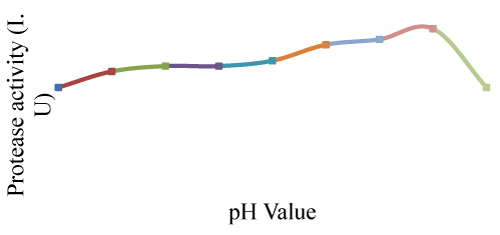
Graph 3:
Proteases production vs. pH value.