 |
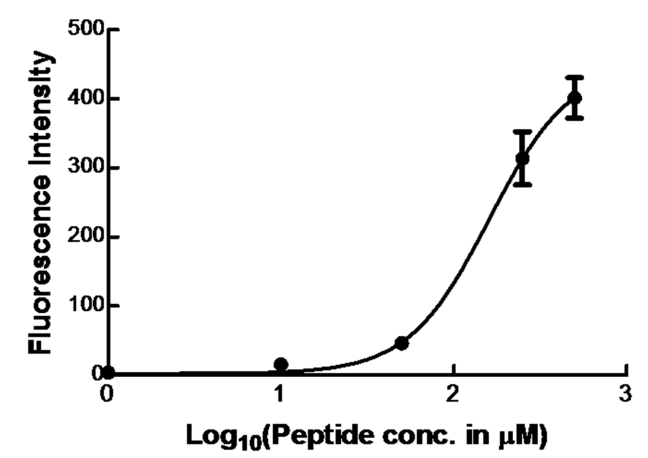
| Figure 1: Dose Response Curve for BI-10FAM. The average fluorescence intensity and its standard deviation (n=5) was plotted as a function of peptide concentration (1.0 ||M, 10.0 ||M, 50 ||M, 250 ||M, and 500 ||M) and fitted to a sigmoidal curve (solid line). Note, the error bars of the first three points are small and covered by the size of markers. |