 |
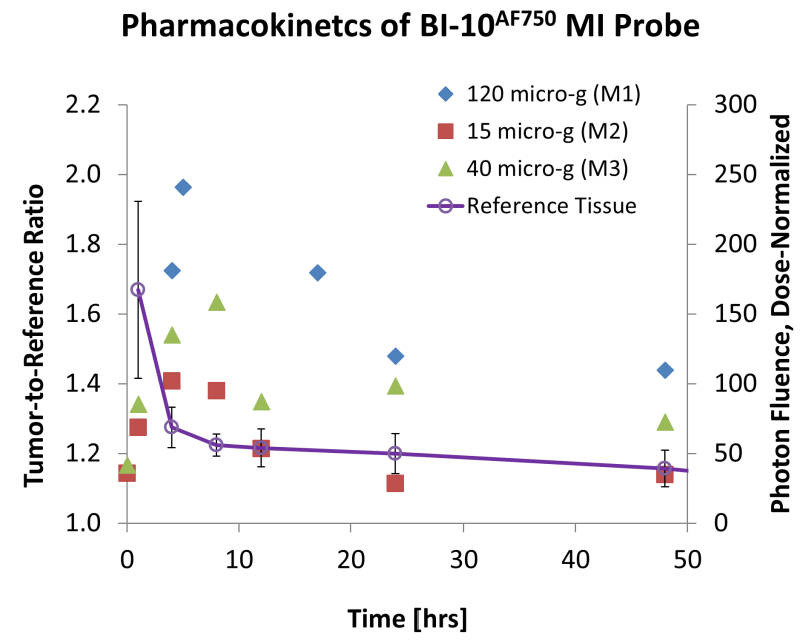
| Figure 2: Kinematics of BI-10AF750 Molecular Imaging (MI) Probe. (Primary Axis) Plotted is the tumor-to-reference tissue (muscle) ratio (TRR) as a function of time for three mice (M1-M3) each injected with 120 ||g (blue), 40 ||g (green), and 15 ||g (red) of the BI-10AF750 MI probe. The peak TRR occurred within 4-8 hours post-injection. (Secondary Axis) Similarly, the average dose-normalized fluorescence signal is plotted as function of time for muscle (n=3) from which the BI-10AF750 clearance rate was determined to be 4 hours. |