 |
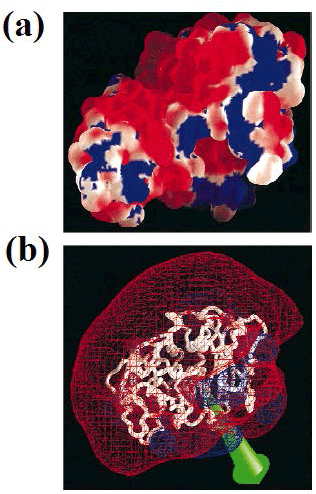
| Figure 4: (a): Representation of solvent-accessible molecular surface. The entrance to the active-site gorge is centered within the large red area near the top left. Color coding represents electrostatic potential surfaces: 2.5 kT/e in blue and 22.5 kT/e in red. (b): Schematic drawing of the 60.25 kT/e isopotential surface of DmAChE. Orientation is the same as in (a), and the green arrow denotes the direction of the dipole moment. |