 |
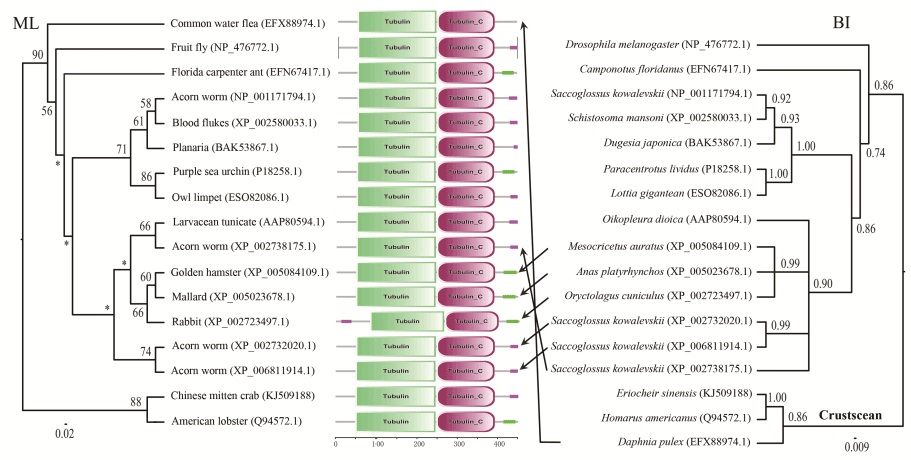
| Figure 1: Phylogenetic analysis of EsTUBA and other representative Tubulin proteins. Support values [bootstrap values greater than 50% and posterior probability support values greater than 0.7] for maximum likelihood (ML) and Bayesian inferences (BI) analyses, respectively, are shown above major branches. The scale bar represents a branch length of 0.02 amino acids for ML topology. The scale bar represents 0.009 substitutions per site for BI topology. The GenBank accession numbers of all taxa are listed in ‘Supplementary Table S2’. Predicted protein domain architecture of representative Tubulins determined by SMART analysis. Coiled coil regions are shown in green and low complexity regions in pink. |