 |
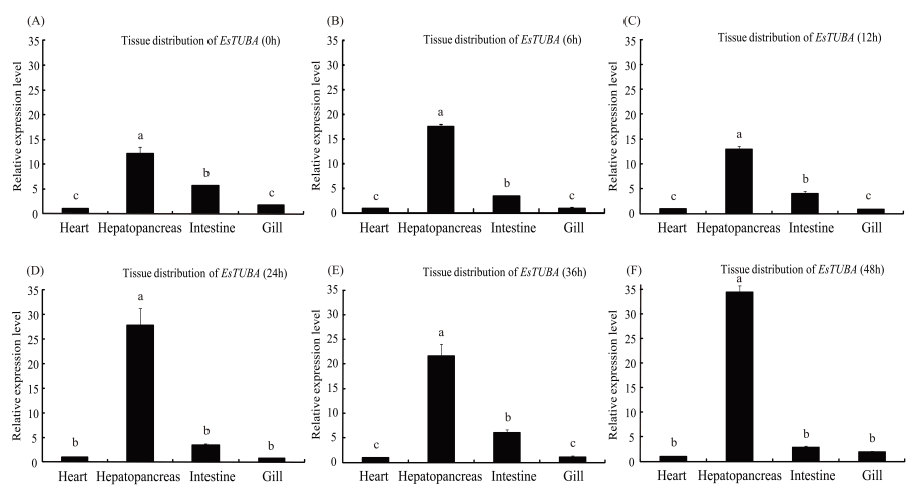
| Figure 4: Analyses of EsTUBA mRNA expression by RT-qPCR in heart, hepatopancreas, intestine, and gill in response to Vibrio parahaemolyticus challenge (black bars) at 0 h, 6 h, 12 h, 24 h, 36 h and 48 h. Tissues collected from crabs injected with V. parahaemolyticus (black bars) were compared with respect to EsTUBA mRNA expression (relative to β-actin) using Tukey’s post hoc test. Error bars represent mean ± S.E. of three independent investigations. Means with different letters differ significantly (Tukey’s post hoc test, α=0.05). |