 |
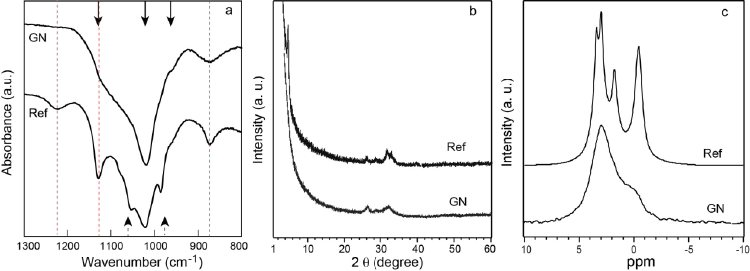
| Figure 1: (a) FTIR spectra for reference (Ref) and gold nanoparticles-containing (GN) solutions. Solid arrows (963, 1021, and 1128 cm–1) indicate peaks corresponding to OCP, red dotted lines indicate peaks corresponding to OH– (1220 cm–1) and HPO4 2– (872 and 1128 cm–1) ion vibrations in OCP, and dotted arrows (985 and 1052 cm–1) indicate peaks corresponding to PO4 3– ion vibration in OCP. (b) XRD patterns for initial precipitate from reference (Ref) and gold nanoparticles-containing (GN) solutions. (c) NMR spectra of initial precipitate from reference (Ref) and gold nanoparticles-containing (GN) solutions (reproduced with permission of use from Ame. Mine. vol. 100 (2015). Copyright 2015, Mineralogical Society of America). |