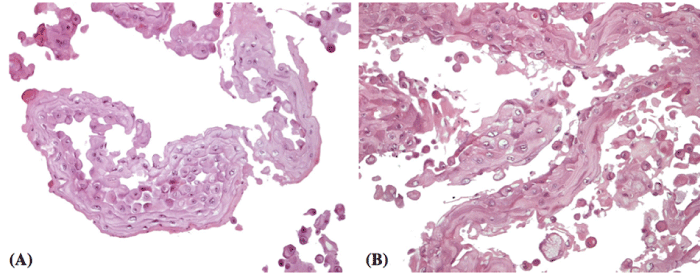
Figure 2:
A.Representative image of the H and E stained keratinocyte sections in ESWT group. B. Untreated control group.