|
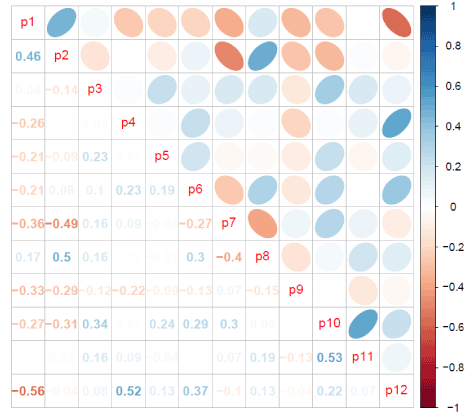
| Figure 1: Correlogram based on the Spearman rank correlation between the different TEM parameters measured. Correlation coefficients are given in the lower triangle. Color denotes the strength of the correlation. If the correlation circle tilt to the left the correlation is negative, and if it tilts to the right the correlation is positive. When close to round, the correlation is close to neutral. The parameter for which the micrographs were scored for are: mitochondria (healthy [P1] or unhealthy [P12]), mitochondrial anchorage (P2), edema (P3), vacuolization (P4), presence of rodlet cells (P5), bacteria-like particles (P6), inter-epithelial lipid storage (P7), terminal web (P8), intraepithelial leukocytes (IEL) (P9), damaged microvilli (P10) and the presence of cell debris in the lumen (P11). |