 |
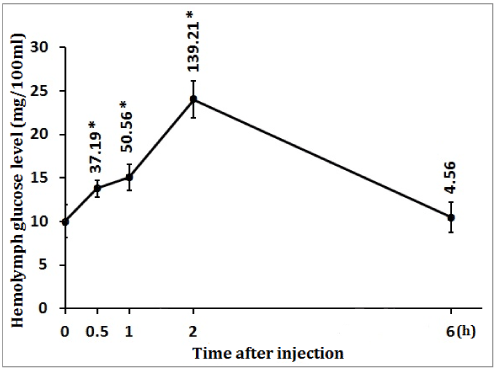
| Figure 2: Time course action of 13-CRA-induced hyperglycemia in intact crabs. Hemolymph was collected from intact crabs after injection of retinoic acid (25 μg/g live mass), at the time points indicated for glucose quantification. Each point represents a mean ± S.D. of 8 individuals. Values in parenthesis represent percent change from control (0 h). *p<0.05. |