 |
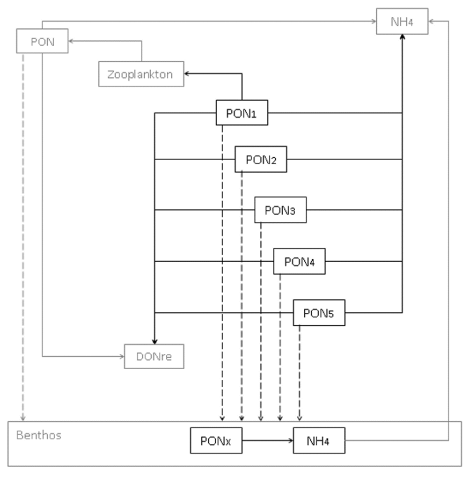
| Figure 2: Scheme of the modelled nitrogen and phosphorus pools; for simplicity, only the nitrogen pools are represented. Arrows denote the processes that link the different components of the algorithm. The structure and processes from the basic setup of the Mohid Water Quality module are represented in dark gray, whereas the adapted processes for the POM pools simulation are represented in black. Sinking rate is represented by the dashed arrows. PONx stands for all PON pools. |