 |
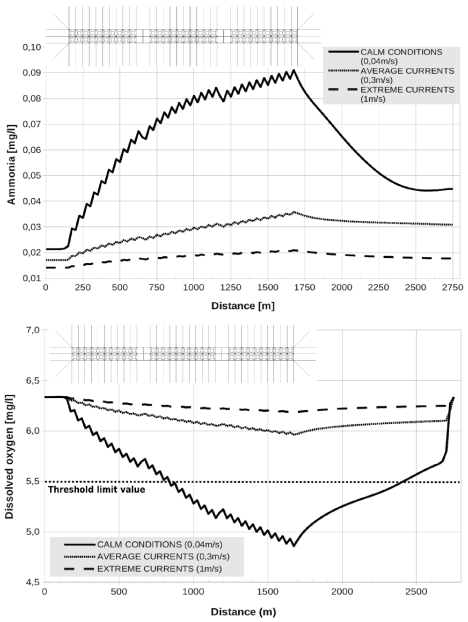
| Figure 4: Ammonia (top) and oxygen (below) concentrations in the PCC simulation. Distance is measured from the beginning of the domain, the cage distribution is depicted on top of each figure. The oxygen threshold limit value is shown in the figure while the ammonia limiting value is out of the range of results. |