 |
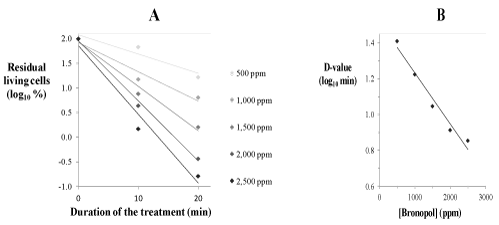
| Figure 4: (A) Impact of the bronopol exposition on the F. psychrophilum JIP02/86 viability. The bacterial cells were exposed to different concentrations of bronopol, treated with EMA and the residual living cells were evaluated by qPCR. (B) D-values (i.e., the exposition time needed to destroy 90% of the initial cells) were determined for each of the bronopol concentrations assayed and were log10–transformed. A correspondence curve was drawn where each data point represents log10D-value determined for the corresponding bronopol concentration. |