 |
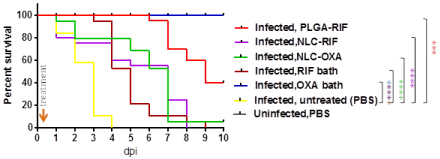
| Figure 4: Kaplan-Meier representation of cumulative survival of zebrafish embryos infected with F.no.-mCh and treated with diffrent therapies 6 hours post infection. One group was included as an uninfected control. Asterisks indicate statistical significance of survival curve differences between treated and untreated groups: **** P<0.0001; *** P<0.001. Standard errors were removed for simplicity. |