|
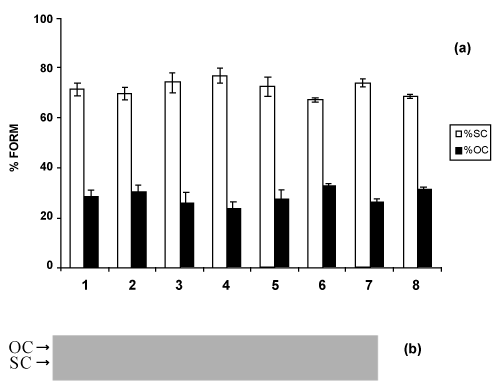
| Figure 3: Percentage of bacterial plasmid forms (a) and photograph (b) of neutral agarose gel after electrophoresis of pBSK plasmids exposed to lowlevel red laser in continuous wave mode and incubated with endonuclease IV. Lanes: (1) pBSK; (2) pBSK+endonuclease IV; (3) pBSK+pulsed laser 0.13 J; (4) pBSK+pulsed laser 0.13 J+endonuclease IV; (5) pBSK+pulsed laser 0.52 J; (6) pBSK+pulsed laser 0.52 J+endonuclease IV; (7) pBSK+pulsed laser 1.04 J; (8) pBSK+pulsed laser 1.04 J+endonuclease IV. (□) SC (supercoiled); (■) OC (open circle). Numbers (1) through (8) for the histogram refer to gel lanes. Error bars indicate the standard deviation of the mean for n=3 independent experiments. |