 |
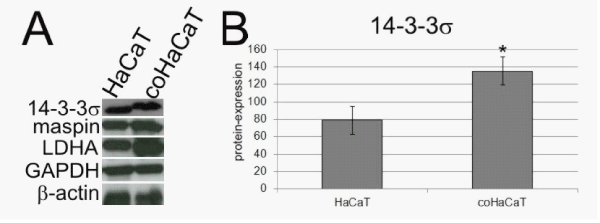
| Figure 2: 14-3-3σ−expression upon co-cultivation. A Western blot results of 14-3-3σ−expression showed the detection of protein-bands in HaCaT and coHaCaT cells. B Graphical analysis of the protein-expression showed significant up-regulated 14-3-3σ in coHaCaT. * (p< 0.05). |