
|
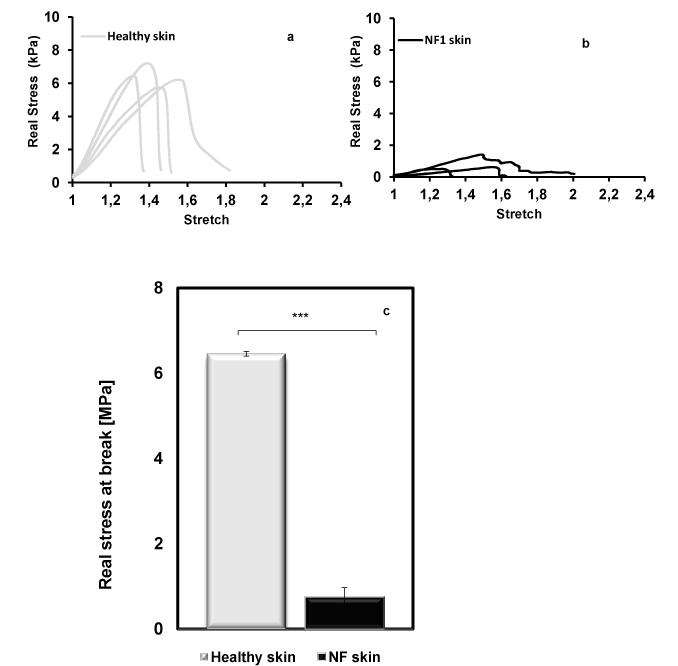
| Figure 3: Real stress versus stretch curves for a same location (arm skin), oriented along Langer lines at a frequency of 1 Hz during a tensile tests until rupture: (a) healthy patients (light gray symbols) and (b) NF1 patients (dark gray symbols). (c) Average real stress at break according skin type and location. ***corresponded to p< 0.001. |