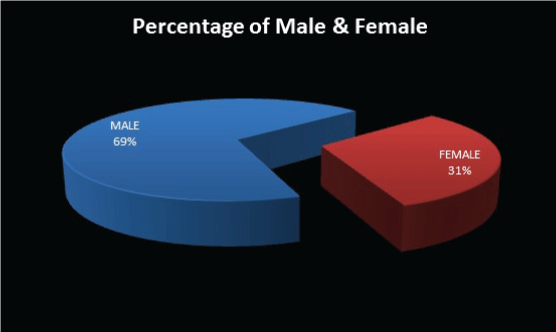
Figure 2:
Pie diagram showing the gender wise distribution.