 |
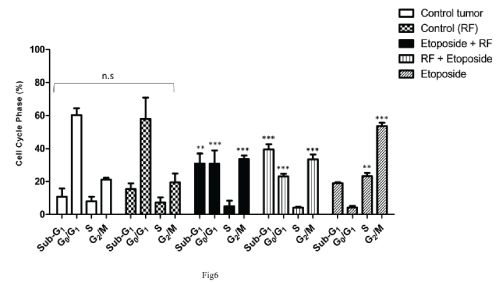
| Figure 6: Analysis of cell cycle phases of tumor cells treated. Results represent means ± S.D. from three independent experiments, obtained by flow cytometry analysis. Proportion of tumor cells residing in sub-diploid; G0/G1; S and G2/M phases. Statistical differences *p<0.05; n.s=no significance. |