|
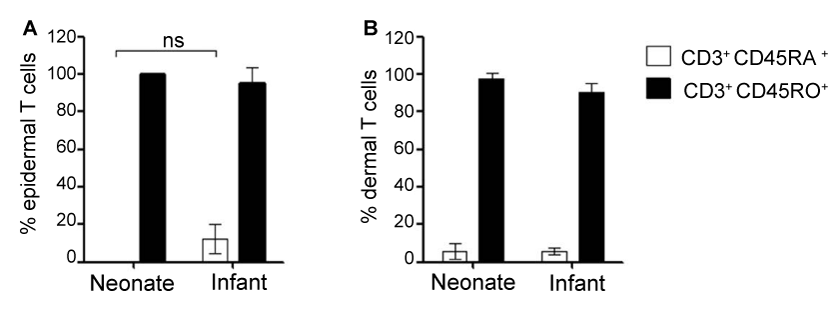
| Figure 4: Frequency of naive and memory T cells in neonatal and infant skin. Frozen human foreskin samples from neonates (n=3) and infants (n=3) were analyzed. Diagrams show the relation of naive (CD3+CD45RA+, white bars) and memory (CD3+CD45RO+, black bars) T cells in human skin. T cell numbers in the epidermis (A) and dermis (B) were evaluated, by counting naive and memory T cells in different donors on cryosections. ns = not significant. |