 |
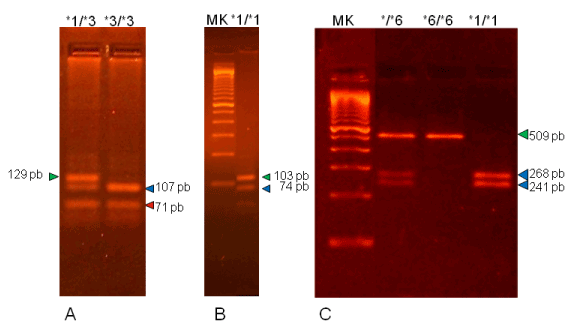
| Figure 1: Representative band patterns of CYP3A5*3 and CYP2B6*6. MK: marker of 1 Kb A) Lines: 1- CYP3A5*3 in heterozygosis; 2- CYP3A5*3 in homozygosis. B) Lines: 1 – Marker, 2- CYP3A5*3 wild type C) Lines: 1 – Marker, 2- CYP2B6*6 in heterozygosis, 3 - CYP2B6*6 in homozygosis, 4- CYP2B6*6 wild type Other experimental conditions are described in Materials and Methods. |