|
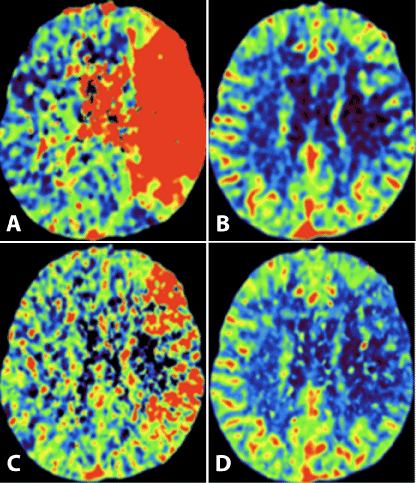
| Figure 1: CTP brain demonstrating increased TTP in the entire left MCA territory (A) and decreased CBV in the left centrum semiovale, mid frontal lobe, and high convexity (B). MTT maps reveal a small area of decreased MTT potentially representing infarct core and larger area of increased MTT showing ischemic penumbra (C), for comparison CBF is shown in panel D. |