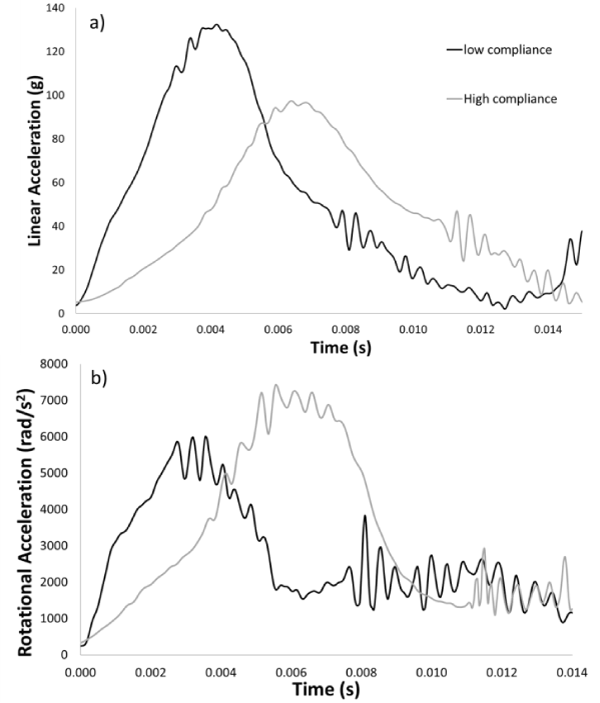
Figure 4:
Depicts the dynamic response curves, peak linear acceleration (a), and peak rotational acceleration (b), for a low (short duration) and high (long duration) compliance impact at 6.5 m/s.